Last year we asked the public what concerns them most about charities, looking in particular at what puts them off supporting a charity, as well as what would encourage them to give. Research carried out as part of our Charity Awareness Monitor (CAM) revealed some interesting insight, which we explore below in ten nuggets about how the public think their ideal charity should spend its money.
Nugget 1: 56% of the public would give more if they knew more about how their money is spent.
The majority of people are put off giving to a charity where too little money is going to the cause. They care about how charities spend their money so it doesn’t suffice to say that ‘as long as the money is going to the charity then it is ok.’ The public want to know exactly where their money is going and 56% would be encouraged to give if they felt there was more clarity on where donations were spent[1]. Greater transparency would seem to encourage people to give to a charity. If a charity isn’t seen to be being transparent, the public may think they have something to hide. It is therefore essential that charities continue to make efforts to communicate clearly to the public on how they spend their income.
Nugget 2: The public want 57% of their donation spent on helping beneficiaries
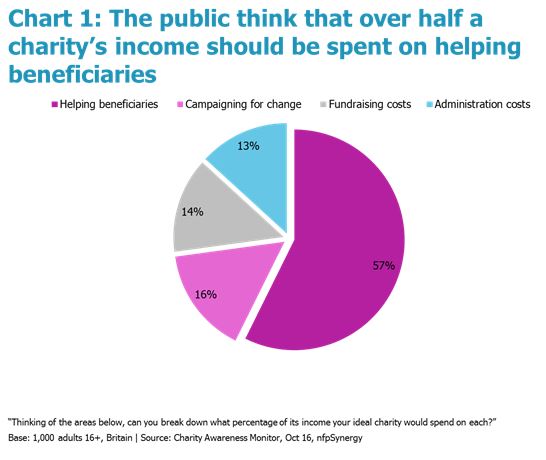
In October 2016[2], we asked the public how they felt their ideal charity should distribute its income. Unsurprisingly the public as a whole felt that over half (57%) of the charity’s income should go to helping beneficiaries (see Chart 1), as opposed to other activities. Last year, Cancer Research UK spent 71% of their income on helping beneficiaries.[3] This is noticeably higher than what the public think is the right amount, indicating there is lack of awareness among the public about what charities are actually spending on the cause. Highlighting the impact of your work in terms of positive outcomes for beneficiaries is consequently an important component of any effective marketing and communications strategy.

Nugget 3: The public say their ideal is to spend on admin, fundraising and campaigning in nearly equal proportions
After spending the majority of income on helping beneficiaries, the public then want the rest of income split almost equally among the three other areas (campaigning for change, fundraising costs, and administration) (see chart 1). This indicates that generally the public feel these areas of spending are of equal importance, although there is some variation in terms of age. Chart 1 shows this overall split clearly.
Nugget 4: The public want their ideal charity to spend some money on campaigning
‘Campaigning for change’ is regarded as an important part of a charity’s spending overall (16%). 16-24 year olds think this should be as high as a fifth of a charity’s income. This might be because young people are better able to support a charity by campaigning rather than giving financially. In addition, it is possible that young people are more greatly aware of the effectiveness and impact of campaigning.
Nuggets 5: Fundraising is an important part of a charity’s expenditure
How much a charity budgets for fundraising is important, after all it’s how a charity makes people aware of their causes and generates most of their income. The perception the public have on fundraisers and fundraising methods impacts their giving. About a third of the public would not give to a charity if a fundraiser was being too persistent or fundraising methods were too intrusive. These levels are noticeably lower than the previous year which could be as a result of less contact with fundraisers.
Nugget 6: Older people are much more restrictive about how their ideal charity spends its income
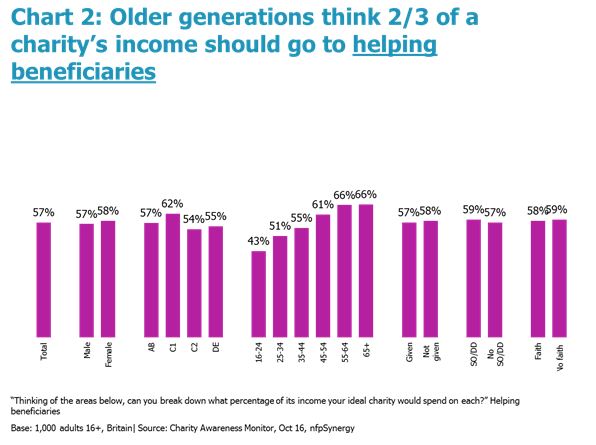
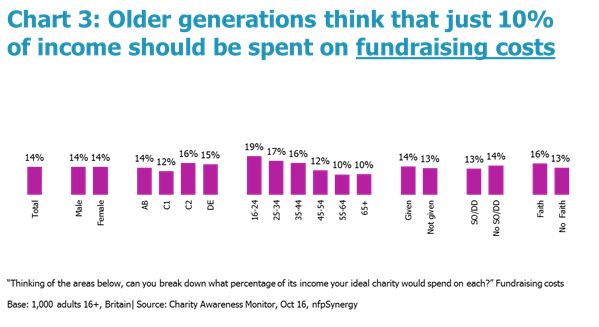
Older people (55+) felt that helping beneficiaries should be higher than other age groups and put this at 2/3 of income (see chart 2). As a result they restrict how much money can be spent on other areas of expenditure. Older people (55+) think that just 10% of a charities income should be spent on fundraising costs (see chart 3).
Nugget 7: Young people are much less restrictive about charity expenditure
By assigning less money to helping beneficiaries (still the majority of the money apportioned) young people allow a larger proportion to be used for campaigning, fundraising and administration. By contrast, this is down to 43% for young people (16-24) but still remains the largest proportion of spending (see Chart 2). 16-24 year olds, for example, would put 19% of income into fundraising costs, compared to the 14% apportioned by the public as a whole.
Nugget 8: Gender and social grade demographics don’t change perceptions much
It is evident from charts 2 and 3 that the gender and social grade of a person has limited impact on how their ideal charity spends its income. In addition, having a faith or giving to a charity doesn’t change perceptions either. It seems that age is the distinguishing factor in the variation of how an ideal charity’s spends its income.
Nugget 9: Administration costs are necessary, but the smallest part of where the public believes income should go
Administration costs should be the lowest part of expenditure according to the general public (13%). This is hardly surprising given the importance for the public of transparency in spending and the desire to know that their money has gone on helping a particular cause. The issue for charities is that administration costs – whilst integral to running an effective charity – are not always fully connected with the benefit this brings to beneficiaries and the cause in the public’s eyes. The public are uncomfortable with the thought that their donation goes to paying staff. However, there is some recognition that administration costs do exist and are a necessary part of a charity’s expenditure, but should simply be the smallest component of this.
Nugget 10: It makes no difference whether the term admin or running costs is used
In an earlier wave of research in 2016 we asked the public the same question but used the term “running costs” rather than “administration”. We changed this for the October wave to see if it would have any impact in how people feel income should be spent. This made no difference. The public said 14% of income should be spent on “running costs” compared to 13% for “administration”.
If you would like to find out more about our Charity Awareness Monitor, follow this link. You can download this blog in report format using the purple download form located beneath the social sharing buttons. Please share your thoughts on this topic in the comment section underneath the download form too!
[1] As a caveat on the nature of giving research and the role of social desirability bias (e.g. respondents saying what they think the researcher would like to hear) it’s difficult to be certain that this is a true predictor of actual future behaviour. It is difficult to say whether the amount the public would give would actually change in practice, and would require further testing.
[2] All research with 1000 representative members of the GB public carried out online
[3] Cancer Research UK, Beating Cancer Sooner, Annual Report And Accounts 2015/16


